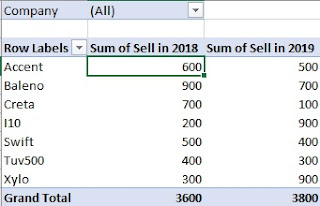
When working with large amounts of data, it can feel overwhelming to find insights quickly. That’s where Excel Pivot Tables come in. They allow you to summarize, analyze, and visualize data in just a few clicks.
Whether you are a student analyzing project data or a professional creating reports, mastering Pivot Tables will take your Excel skills to the next level.
🔹 What is a Pivot Table?
A Pivot Table is a tool in Excel that helps you:
-
Summarize large datasets instantly
-
Group and filter information
-
Create meaningful reports without writing formulas
-
Generate quick insights with charts
Simply put, Pivot Tables turn raw data into structured insights.
🔹 Why Use Pivot Tables?
✅ Save Time – No need to use complex formulas.
✅ Flexibility – Rearrange rows and columns anytime.
✅ Interactive Reports – Slice and dice data easily.
✅ Professional Output – Impress teachers, managers, and clients.
🔹 Step-by-Step: How to Create a Pivot Table
Step 1: Select Your Data
-
Highlight your dataset (or use a table).
-
Go to Insert → Pivot Table.
Step 2: Choose Where to Place It
-
Select New Worksheet (recommended).
Step 3: Drag & Drop Fields
-
Drag columns into Rows, Columns, Values, and Filters areas.
-
Example: Sales data → Region (Rows), Product (Columns), Sales (Values).
Step 4: Apply Formatting
-
Right-click values → choose Summarize by Sum, Count, Average.
-
Use Number Formatting for clean reports.
🔹 Step-by-Step Examples
📊 Example 1: Student Project
You have exam scores of students across multiple subjects.
-
Drag Subject → Rows
-
Drag Student Name → Columns
-
Drag Marks → Values
👉 Instantly see which student performs best in each subject.
📊 Example 2: Professional Report
You have monthly sales data across regions.
-
Drag Region → Rows
-
Drag Month → Columns
-
Drag Sales → Values
👉 Get a clear report showing sales trends by region and month.
🔹 Advanced Features to Try
-
Slicers & Timelines
-
Add interactive buttons to filter data quickly.
-
-
Pivot Charts
-
Create dynamic charts linked with your Pivot Table.
-
-
Calculated Fields
-
Add custom formulas inside your Pivot Table (e.g., Profit = Sales – Cost).
-
🔹 Pro Tips for Pivot Table Mastery
-
Always convert your dataset to a Table before inserting a Pivot Table (Ctrl + T).
-
Use Refresh All to update reports when data changes.
-
Rename fields for cleaner presentation.
-
Combine with Power Query for automated reporting.
🔹 Final Thoughts
Pivot Tables are one of the most powerful tools in Excel. They not only help you analyze data like a pro but also save hours of manual work.
👉 Start by practicing with small datasets and gradually explore advanced features like slicers and calculated fields.
Once you master Pivot Tables, you’ll find yourself creating professional-grade reports in minutes instead of hours!


